
Gravitational Attraction
What would happen if two people out in space a few meters apart, abandoned by their spacecraft, decided to wait until gravity pulled them together? My initial thought was that …

So I got pointed to the http://www.icr.org, which if you haven't poked around on the site, you really should. It is quite interesting (not really in a good way). However, I want to look at a particular article on the young earth, arguing from population growth rates. The relevant sentences are:
Using census records from the last 400 years and a bit of algebra, and assuming a natural logarithmic growth, eight Flood survivors 4,500 years ago produce 7 billion people almost exactly. This is powerful evidence that biblical history is accurate, and man-made evolutionary history is not.
Then they footnote the following:
The formula for logarithmic human world population growth is \(P = Po e^{rt}\), where P = the current population, Po = the initial population, e = the base of natural logarithms (2.718), r = the average annual population growth rate (0.456% or 0.00456 in the calculator), and t = the time interval from \(P_o\) to \(P\).
Finally, in the middle of the article, they are incredulous of the low net birth rate in pre-agricultural human populations:
Thus, the first human couple that supposedly evolved from ape-like ancestors would have had only 6 million descendants after 2.4 million years. This requires a population growth rate of about 0.000000009-essentially zero. Virtually no growth for 2.4 million years?
So, how do we respond to this sort of analysis? One could try to simply write it off as the rantings of a person blinded, by their religious bias, to a true understanding of science. However I prefer an alternative approach. It may be tilting at windmills, but I prefer to take a claim at face value, and see why it fails, and to ask followup questions. Since the math here is so simple, it is easy to demonstrate any errors, assumptions, etc.. and get to the bottom of it. So, someone has made a claim, I don't agree, how do I proceed?
The first thing I like to do is, assuming they are right in all of their numbers, do they do the calculation correctly. This eliminates a pretty obvious error that could have caused the problem. I suspected they got it right, but I wanted to make sure. The math is
The code is:
r=0.00456
t=4500.0
Po=8.0

print Po*exp(r*t)/1e9,"billion"
Yielding
6.52849018681 billion
The other direction is, how long ago were there only 8 people?
or
Po=6.5e9  # current population
r=0.00456
P=8       # target population

t=(log(P)-log(Po))/r
print t, "years"
resulting in
-4499.04089302 years.
Here I am using data from census.gov. It is possible (in fact likely) that the original post used a slightly different data set, but they didn't cite it so I can't confirm that. The conclusions will not be qualitatively different, but that would be one of the questions I'd have for the author (see below).
It is instructive to look at the data set both on a normal scale and a log scale. The key thing here is that a constant growth rate translates to a straight line on the log scale. Let's see if this is the case (see the lower of the two plots, especially):
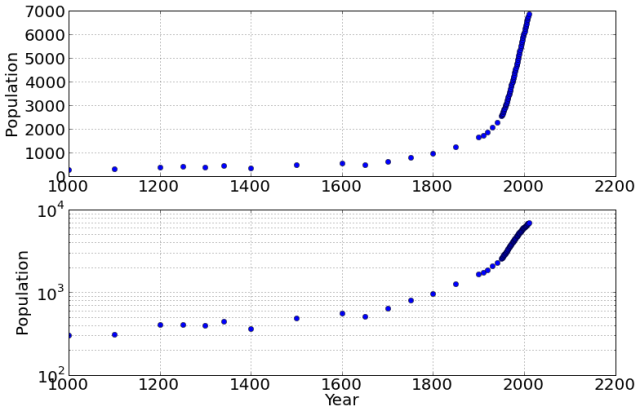
Linear? Not so much.
I then chose a time-frame over which to calculate the average which gave (for my data set) as close to their growth rate above - this is essentially the growth rate consistent with the Biblical chronology. In my data set that average is from 1300 to 2010, or 700 years (theirs, they claim, it was 400 years so there is clearly a difference in data sets here - however, they don't reference their actual data, and regardless, this same analysis would work in their case too).
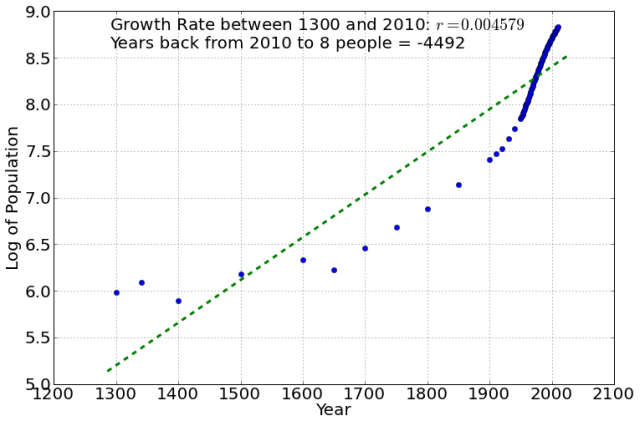
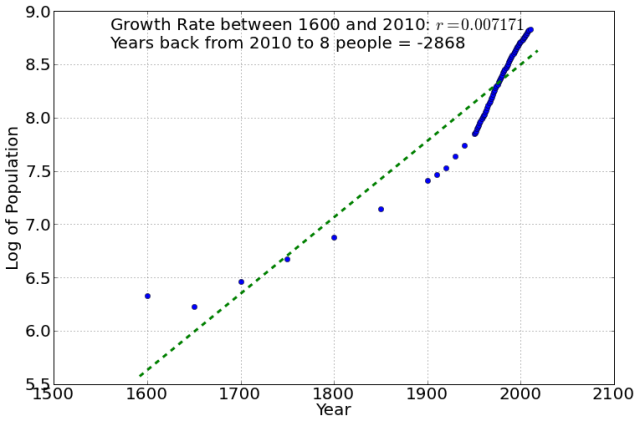
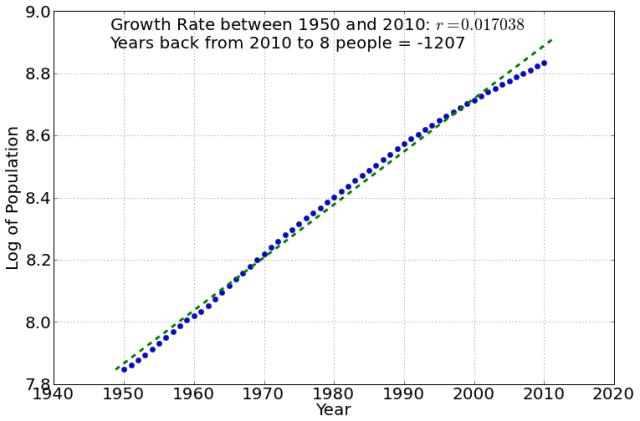
You can see from here that this average yields the Biblical number of 4500 years ago, but that it is clearly not a good assumption to think that the growth rate, even over this time-frame, is constant. Because of this, depending on how far back you do the averaging, you get a different time of the Flood. For example, the following show cases for 1600-2010, and 1950-2010. The last one is the closest to a constant growth rate, but gives a ridiculous -1200 years back to 8 people!
(As an aside, Richard Dawkins does the same calculation with rats, and comes up with an astonishing 1900 or so for the beginning of the Earth.)
The biggest problem with this calculation is assuming a constant growth rate. Once it isn't constant, then the time-frame over which you calculate the average makes a big difference. Only one possible time-frame will result in something consistent with the Biblical account, so one would have to justify:
You can't use as a reason "because it's consistent with the Biblical account", because the entire point is to justify the Biblical account, or to demonstrate that the data is consistent with it. It's not, if you have to postulate that the Biblical account is correct, and choose the specifics of the calculations to meet that.
Here are the questions I'd like answered. I'm not expecting any, but I'd be thrilled to get one!
The original article was astounded that the growth rate, prior to agriculture, could be so low. Essentially, they seem to believe that exponential growth should have started once you had people, and gone at a constant rate the entire time. However, before agriculture, there would have been a fairly low carrying capacity, and human population would follow logistic growth, not exponential. Near the carrying capacity, the growth rate is essentially zero, exactly as observed. A little bit of reading on how populations actually change might be helpful to these people.
Gravitational Attraction
What would happen if two people out in space a few meters apart, abandoned by their spacecraft, decided to wait until gravity pulled them together? My initial thought was that …

A Simple Physics Problem Gets Messy
A physics problem from a practice AP test came to my attention, when my daughter was in AP physics this past spring. I went over her solutions when she did …

Skepticism and Dubious Medical Procedures
In my discussion with Jonathan McLatchie on the Still Unbelievable podcast, I said that there hasn’t been a verified miracle claim even since Hume’s essay on miracles. Here I look into the papers he references in response.
What problems are you interested in? How can I help?